Article by Robert Michaud
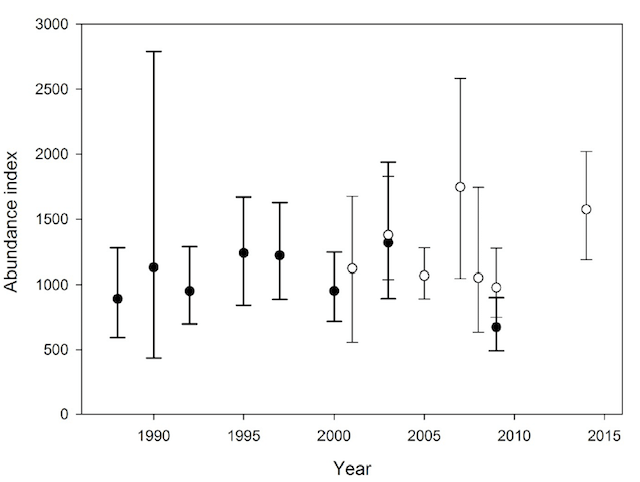
Fisheries and Oceans Canada recently published the results of the most recent St. Lawrence beluga census, which was conducted in the summer of 2014. The abundance index, calculated from eight visual aerial surveys conducted in August and September, puts the number of belugas in 2014 at approximately 1,600, or nearly twice as many as the 2012 estimate, which placed the population at fewer than 900. The authors of the study point out however that the 2014 index, which is based on a different census technique, cannot be compared to previous indices and is not a sign of a growing population. The latter is still considered to have been declining at an annual rate of 1 to 1.5% since the early 2000s and its “endangered” status has recently been made official in the Canada Gazette.
Ever since the St. Lawrence beluga appeared on the Canadian endangered species list in 1983, the size and trajectory of its population have been the subject of debates and the source of confusion on a multitude of occasions. This week, Whales Online provides an overview of this question at once simple and complex: how many belugas are there in the St. Lawrence?
Counting belugas
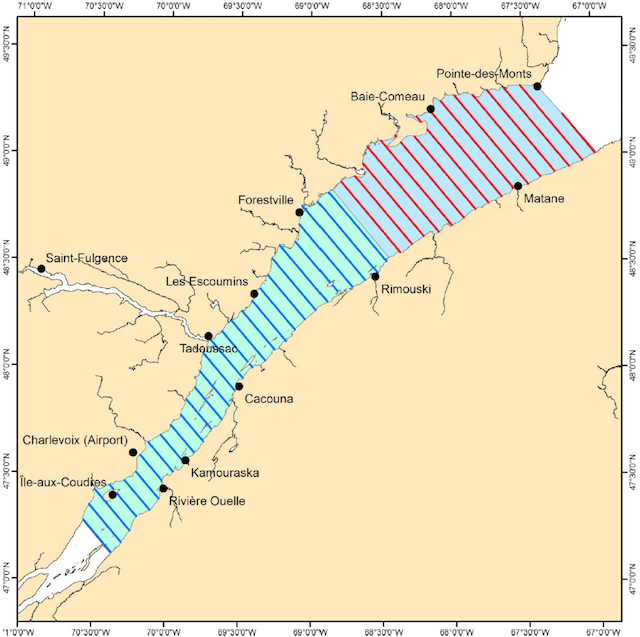
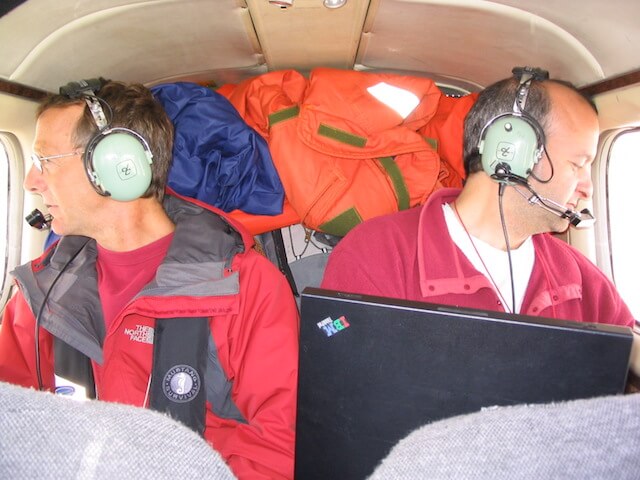
Tallying belugas is not as straightforward as it might seem. Since the early 1970s, several census types have been used to quantify the population of St. Lawrence belugas: aerial photo or visual surveys with transects parallel or perpendicular to the coast and even surveys by boat. The problem is that each method yields a different result. In 1988, after a few failed attempts to integrate the indices of the initial censuses to evaluate the population trajectory, researchers from Fisheries and Oceans Canada adopted a systematic protocol, which they were able to apply every three to five years until 2009. Using two aircraft equipped with high-precision photo devices, they were able to cover the beluga’s entire summer range in just a few hours. Beginning in 2001, they also alternated photo surveys with visual surveys.
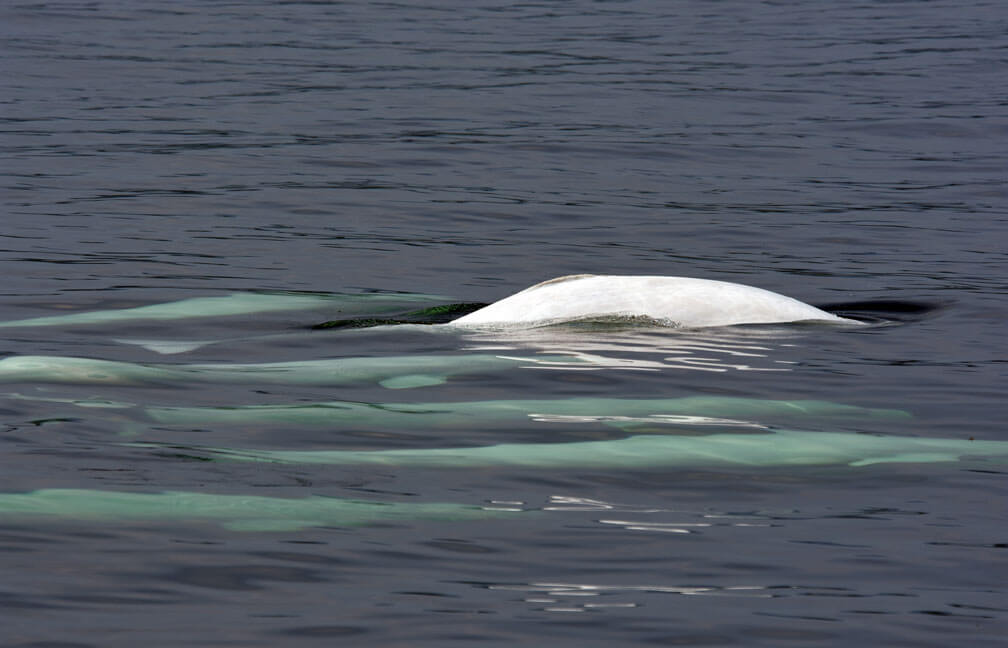
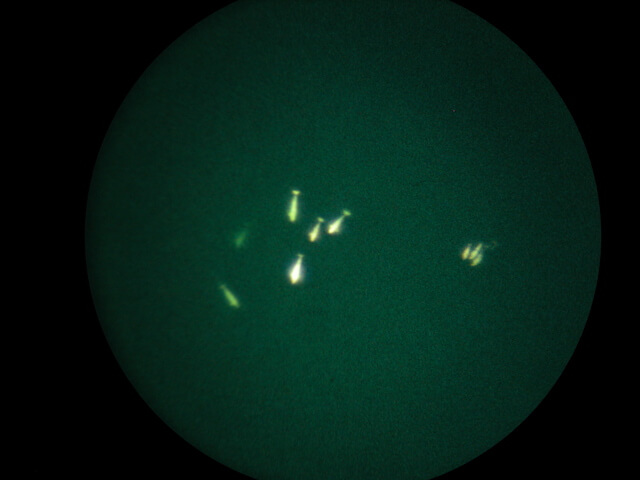
Both methods are used to count the number of animals at the surface. Photo surveys generally tally between 200 and 300 individuals, while visual surveys produce more variable counts ranging from 100 to 400. The results of the two census types therefore cannot be directly compared.
Unfortunately, the type of film used for photo surveys is no longer available and the 2014 census therefore consisted of a visual survey only.
Estimating the size of the population
Regardless of whether visual censuses or photo censuses are performed, estimating the size of the population requires a certain dose of statistical gymnastics. Correction factors must be used to account for animals below and thus invisible at the surface, as well as for sectors not covered by photos or watchful observers.
In the case of photo surveys, snapshots cover approximately half of the beluga’s distribution range. The number of belugas counted at the surface must therefore be multiplied by a factor of 2, assuming that each half contains the same number of animals. For visual surveys, although the principle is the same, the adjustment is more complex. Taken into account are the facts that it is easier to count belugas swimming just below the aircraft and that the probability of overlooking a few animals increases as one moves away from the transect line. The number can therefore be adjusted by accounting for the chances of detection. Thus, with a few tweaks, either method can be used to estimate the number of belugas visible at the surface.
However, to deduce the true size of the population, the proportion of belugas below the surface and invisible to the human eye or camera must also be estimated. Like all cetaceans, belugas spend a good deal of their time below the surface. In the first censuses, researchers multiplied the pre-adjusted counts in non-covered sectors by 1.08, a correction factor that was considered to be quite conservative. Beginning in 2002, the correction factor, calculated based on beluga monitoring by helicopter, changed to 2.09. With a single calculation, the population estimates at the time went from 500-600 belugas to between 1,000 and 1,200, sparking widespread confusion in both the media and the population at large.
Although researchers continue to use 2.09 as a correction factor, a study currently being carried out with new data deemed even more reliable (this time obtained from telemetric monitoring conducted between 2002 and 2006) may soon result in a new adjustment.
Evaluating the population trajectory
Researchers have two independent abundance indices for evaluating the population trajectory. Unfortunately, given the margins of error in each estimate, no single series can be relied on to detect a significant trend. An analysis of the efficiency (known as “power” in statistics) of these surveys estimated that it could take up to 40 years to detect an increase or decrease in the order of 1%, and up to 20 years to identify a change of 3%. Researchers are currently working on increasing the comparability of indices deducted from photographic and visual censuses, which could help raise the detection power of the series of censuses.
The 2012 estimate – considered to be the reference – is based on a mixed approach, i.e. a population model that incorporates information on the belugas’ vital parameters (e.g. age at first reproduction, number of years between births, and senescence), the proportion of young in the population (estimated by analyzing aerial photos), the number and age of mortalities recorded and the population size indices obtained from the photo censuses. Thanks to this model, which was developed by researchers at Fisheries and Oceans Canada the year following the surge in newborn mortalities in 2012, we know that the population has been declining at an annual rate of 1 to 1.5% since the early 2000s and that in 2012, it numbered 889 individuals. Obviously, this estimation approach also has its uncertainties. In summary, we can say that there is a 95% chance that the size of the population in 2012 was between 670 and 1,170 individuals and a 50% chance that it was between 810 and 980 individuals.
How many belugas are there today? Given that the results of the 2014 census cannot be incorporated into the model, the best information currently available remains the 2012 estimate. Researchers from Fisheries and Oceans Canada, thanks to the latter’s vast network of collaborators, are pursuing their efforts to expand and build upon our knowledge and tools to track the evolution of this small population. That’s science.
Staying vigilant
Protecting and supporting the recovery of threatened and endangered species represent considerable challenges and require correspondingly intensive efforts. One of these challenges is population monitoring. Promptly identifying any change in the size, composition or behaviour of an endangered population can be critical in terms of our ability to react and the effectiveness of our actions. The difficulty in counting belugas and detecting changes in their population trends means that we must be very cautious.
Sources
- Gosselin, J.-F., Hammill, M.O., Mosnier, A. and Lesage, V. 2017. Abundance index of St. Lawrence Estuary beluga, Delphinapterus leucas, from aerial visual surveys flown in August 2014 and an update on reported deaths. DFO Can. Sci. Advis. Sec. Res. Doc. 2017/019. v + 28 p.
Robert Michaud is scientific director and co-founder of the Group for Research and Education on Marine Mammals. His connection with the whales of the St. Lawrence began when he was hired as a naturalist on board some of the first boats ferrying tourists in search of whales off the coast of Tadoussac in the early 1980s. What was supposed to be a summer job became a life-long endeavour. He is dedicated to promoting a better understanding of belugas so that we might better protect them.


